How to interpret your score
Use your average reaction time as the main signal, not one unusually fast click. Lower milliseconds are better, but the most meaningful comparison is your repeatable trend on the same device.
What does this test measure?
This test measures simple visual reaction time: the delay between seeing a signal and responding. When the screen turns green, your brain detects the change, processes it, and sends a motor command to click.
What skills can this improve?
Repeated practice can support cleaner alertness, more consistent motor timing, and better control of hesitation or anticipation. If you want a broader comparison, pair it with Reaction Test Level 2 or Stroop.
What affects your results
Sleep, stress, focus, caffeine timing, display refresh rate, browser timing, and input latency can all shift reaction time. For consistent tracking, compare results on the same device and browser. You can read more in sleep, stress and cognitive performance.
Tips for reliable results
- Use short sets and focus on your 10-shot average.
- Avoid rapid anticipation clicks.
- Compare sessions under similar conditions and on the same device.
- If you want practical ideas, see how to improve reaction time.
Scientific background
Simple reaction-time tasks are a standard way to sample processing speed and alert responding in cognitive psychology. For broader context, see how reaction time works, average reaction time by age, and the open-access NIH Toolbox overview of processing speed measurement.
FAQ
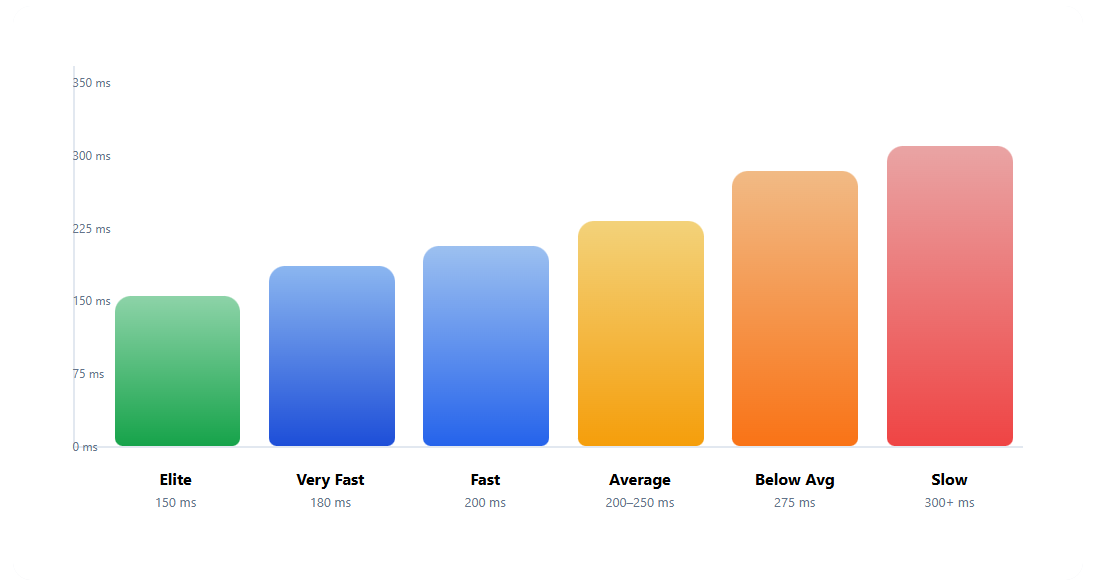
What is a good reaction time?
Most people score between 200-250 ms on a simple visual reaction test. Times below 200 ms are considered fast, while elite gamers often reach around 150 ms.
Why are mobile results often slower?
Phones and tablets add extra latency due to touch processing and display timing. Comparing results between phone and desktop is usually not accurate.
Why do my results change between attempts?
Reaction time naturally fluctuates due to attention, fatigue and anticipation. Your 10-shot average is more reliable than a single click.
Try also
Reaction time is only one part of cognitive performance. You can also try Reaction Test Level 2, Stroop, Memory Test 3x3, or browse the blog for more benchmark and training articles.
For training and self-tracking only; not a clinical or diagnostic instrument.